matplotlib.axes.Axes.bxp
-
Axes.bxp(self, bxpstats, positions=None, widths=None, vert=True, patch_artist=False, shownotches=False, showmeans=False, showcaps=True, showbox=True, showfliers=True, boxprops=None, whiskerprops=None, flierprops=None, medianprops=None, capprops=None, meanprops=None, meanline=False, manage_ticks=True, zorder=None)[source] -
Drawing function for box and whisker plots.
Make a box and whisker plot for each column of x or each vector in sequence x. The box extends from the lower to upper quartile values of the data, with a line at the median. The whiskers extend from the box to show the range of the data. Flier points are those past the end of the whiskers.
Parameters: -
bxpstatslist of dicts -
A list of dictionaries containing stats for each boxplot. Required keys are:
-
med: The median (scalar float). -
q1: The first quartile (25th percentile) (scalar float). -
q3: The third quartile (75th percentile) (scalar float). -
whislo: Lower bound of the lower whisker (scalar float). -
whishi: Upper bound of the upper whisker (scalar float).
Optional keys are:
-
mean: The mean (scalar float). Needed ifshowmeans=True. -
fliers: Data beyond the whiskers (sequence of floats). Needed ifshowfliers=True. -
cilo&cihi: Lower and upper confidence intervals about the median. Needed ifshownotches=True. -
label: Name of the dataset (string). If available, this will be used a tick label for the boxplot
-
-
positionsarray-like, default: [1, 2, ..., n] -
The positions of the boxes. The ticks and limits are automatically set to match the positions.
-
widthsarray-like, default: None -
Either a scalar or a vector and sets the width of each box. The default is
0.15*(distance between extreme
positions)
, clipped to no less than 0.15 and no more than 0.5. -
vertbool, default: True -
If
True(default), makes the boxes vertical. IfFalse, makes horizontal boxes. -
patch_artistbool, default: False -
If
Falseproduces boxes with theLine2Dartist. IfTrueproduces boxes with thePatchartist. -
shownotchesbool, default: False -
If
False(default), produces a rectangular box plot. IfTrue, will produce a notched box plot -
showmeansbool, default: False -
If
True, will toggle on the rendering of the means -
showcapsbool, default: True -
If
True, will toggle on the rendering of the caps -
showboxbool, default: True -
If
True, will toggle on the rendering of the box -
showfliersbool, default: True -
If
True, will toggle on the rendering of the fliers -
boxpropsdict or None (default) -
If provided, will set the plotting style of the boxes
-
whiskerpropsdict or None (default) -
If provided, will set the plotting style of the whiskers
-
cappropsdict or None (default) -
If provided, will set the plotting style of the caps
-
flierpropsdict or None (default) -
If provided will set the plotting style of the fliers
-
medianpropsdict or None (default) -
If provided, will set the plotting style of the medians
-
meanpropsdict or None (default) -
If provided, will set the plotting style of the means
-
meanlinebool, default: False -
If
True(and showmeans isTrue), will try to render the mean as a line spanning the full width of the box according to meanprops. Not recommended if shownotches is also True. Otherwise, means will be shown as points. -
manage_ticksbool, default: True -
If True, the tick locations and labels will be adjusted to match the boxplot positions.
-
zorderfloat, default: Line2D.zorder = 2 -
The zorder of the resulting boxplot.
Returns: - dict
-
A dictionary mapping each component of the boxplot to a list of the
Line2Dinstances created. That dictionary has the following keys (assuming vertical boxplots):-
boxes: the main body of the boxplot showing the quartiles and the median's confidence intervals if enabled. -
medians: horizontal lines at the median of each box. -
whiskers: the vertical lines extending to the most extreme, non-outlier data points. -
caps: the horizontal lines at the ends of the whiskers. -
fliers: points representing data that extend beyond the whiskers (fliers). -
means: points or lines representing the means.
-
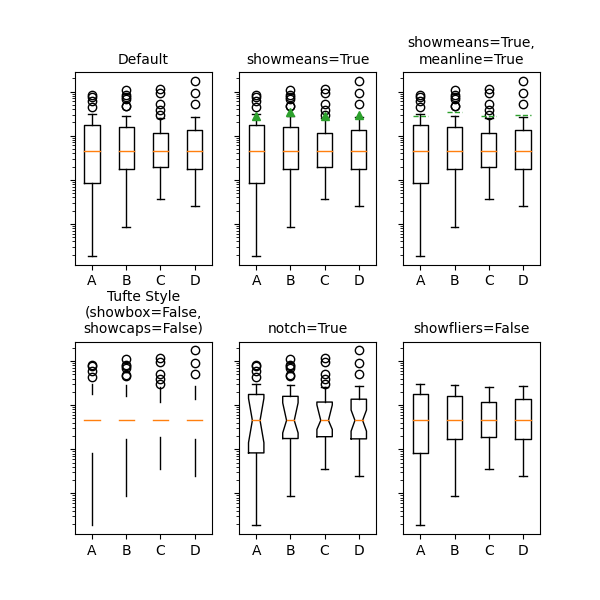
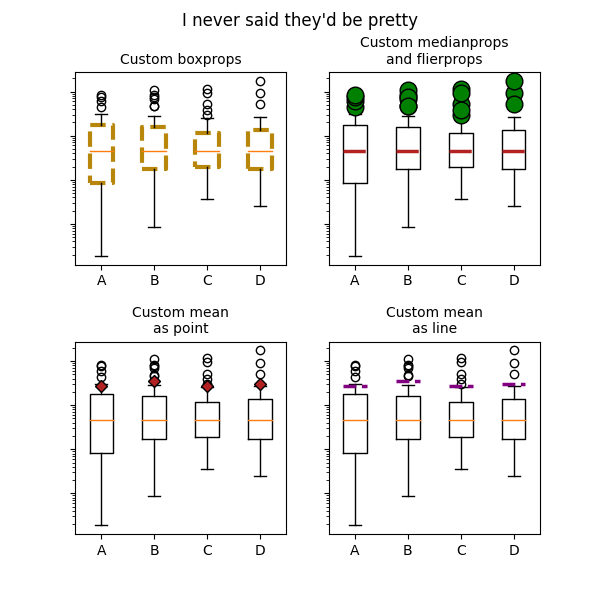
Examples
(Source code, png, pdf)


-
Examples using matplotlib.axes.Axes.bxp

© 2012–2021 Matplotlib Development Team. All rights reserved.
Licensed under the Matplotlib License Agreement.
https://matplotlib.org/3.4.1/api/_as_gen/matplotlib.axes.Axes.bxp.html