numpy.random.RandomState.rayleigh
-
RandomState.rayleigh(scale=1.0, size=None) -
Draw samples from a Rayleigh distribution.
The
 and Weibull distributions are generalizations of the Rayleigh.
Parameters: scale : float or array_like of floats, optional
Scale, also equals the mode. Should be >= 0. Default is 1.
size : int or tuple of ints, optional
Output shape. If the given shape is, e.g.,
(m, n, k), thenm * n * ksamples are drawn. If size isNone(default), a single value is returned ifscaleis a scalar. Otherwise,np.array(scale).sizesamples are drawn.Returns: out : ndarray or scalar
Drawn samples from the parameterized Rayleigh distribution.
Notes
The probability density function for the Rayleigh distribution is
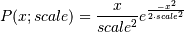
The Rayleigh distribution would arise, for example, if the East and North components of the wind velocity had identical zero-mean Gaussian distributions. Then the wind speed would have a Rayleigh distribution.
References
[R193] Brighton Webs Ltd., “Rayleigh Distribution,” http://www.brighton-webs.co.uk/distributions/rayleigh.asp [R194] Wikipedia, “Rayleigh distribution” http://en.wikipedia.org/wiki/Rayleigh_distribution Examples
Draw values from the distribution and plot the histogram
>>> values = hist(np.random.rayleigh(3, 100000), bins=200, normed=True)
Wave heights tend to follow a Rayleigh distribution. If the mean wave height is 1 meter, what fraction of waves are likely to be larger than 3 meters?
>>> meanvalue = 1
>>> modevalue = np.sqrt(2 / np.pi) * meanvalue
>>> s = np.random.rayleigh(modevalue, 1000000)
The percentage of waves larger than 3 meters is:
>>> 100.*sum(s>3)/1000000.
0.087300000000000003
© 2008–2017 NumPy Developers
Licensed under the NumPy License.
https://docs.scipy.org/doc/numpy-1.13.0/reference/generated/numpy.random.RandomState.rayleigh.html