mpl_toolkits.mplot3d.axes3d.Axes3D
-
class mpl_toolkits.mplot3d.axes3d.Axes3D(fig, rect=None, *args, **kwargs) -
3D axes object.
-
add_collection3d(col, zs=0, zdir='z') -
Add a 3D collection object to the plot.
2D collection types are converted to a 3D version by modifying the object and adding z coordinate information.
- Supported are:
-
- PolyCollection
- LineCollection
- PatchCollection
-
add_contour_set(cset, extend3d=False, stride=5, zdir='z', offset=None)
-
add_contourf_set(cset, zdir='z', offset=None)
-
auto_scale_xyz(X, Y, Z=None, had_data=None)
-
autoscale(enable=True, axis='both', tight=None) -
Convenience method for simple axis view autoscaling. See
matplotlib.axes.Axes.autoscale()for full explanation. Note that this function behaves the same, but for all three axes. Therfore, ‘z’ can be passed for axis, and ‘both’ applies to all three axes.New in version 1.1.0: This function was added, but not tested. Please report any bugs.
-
autoscale_view(tight=None, scalex=True, scaley=True, scalez=True) -
Autoscale the view limits using the data limits. See
matplotlib.axes.Axes.autoscale_view()for documentation. Note that this function applies to the 3D axes, and as such adds the scalez to the function arguments.Changed in version 1.1.0: Function signature was changed to better match the 2D version. tight is now explicitly a kwarg and placed first.
Changed in version 1.2.1: This is now fully functional.
-
bar(left, height, zs=0, zdir='z', *args, **kwargs) -
Add 2D bar(s).
Argument Description left The x coordinates of the left sides of the bars. height The height of the bars. zs Z coordinate of bars, if one value is specified they will all be placed at the same z. zdir Which direction to use as z (‘x’, ‘y’ or ‘z’) when plotting a 2D set. Keyword arguments are passed onto
bar().Returns a
Patch3DCollection
-
bar3d(x, y, z, dx, dy, dz, color=None, zsort='average', shade=True, *args, **kwargs) -
Generate a 3D barplot.
This method creates three dimensional barplot where the width, depth, height, and color of the bars can all be uniquely set.
Parameters: x, y, z : array-like
The coordinates of the anchor point of the bars.
dx, dy, dz : scalar or array-like
The width, depth, and height of the bars, respectively.
color : sequence of valid color specifications, optional
The color of the bars can be specified globally or individually. This parameter can be:
- A single color value, to color all bars the same color.
- An array of colors of length N bars, to color each bar independently.
- An array of colors of length 6, to color the faces of the bars similarly.
- An array of colors of length 6 * N bars, to color each face independently.
When coloring the faces of the boxes specifically, this is the order of the coloring:
- -Z (bottom of box)
- +Z (top of box)
- -Y
- +Y
- -X
- +X
zsort : str, optional
The z-axis sorting scheme passed onto
Poly3DCollection()shade : bool, optional (default = True)
When true, this shades the dark sides of the bars (relative to the plot’s source of light).
Any additional keyword arguments are passed onto
:func:`~mpl_toolkits.mplot3d.art3d.Poly3DCollection`
Returns: collection : Poly3DCollection
A collection of three dimensional polygons representing the bars.
-
can_pan() -
Return True if this axes supports the pan/zoom button functionality.
3D axes objects do not use the pan/zoom button.
-
can_zoom() -
Return True if this axes supports the zoom box button functionality.
3D axes objects do not use the zoom box button.
-
cla() -
Clear axes
-
clabel(*args, **kwargs) -
This function is currently not implemented for 3D axes. Returns None.
-
contour(X, Y, Z, *args, **kwargs) -
Create a 3D contour plot.
Argument Description X, Y, Data values as numpy.arrays Z extend3d Whether to extend contour in 3D (default: False) stride Stride (step size) for extending contour zdir The direction to use: x, y or z (default) offset If specified plot a projection of the contour lines on this position in plane normal to zdir The positional and other keyword arguments are passed on to
contour()Returns a
contour
-
contour3D(X, Y, Z, *args, **kwargs) -
Create a 3D contour plot.
Argument Description X, Y, Data values as numpy.arrays Z extend3d Whether to extend contour in 3D (default: False) stride Stride (step size) for extending contour zdir The direction to use: x, y or z (default) offset If specified plot a projection of the contour lines on this position in plane normal to zdir The positional and other keyword arguments are passed on to
contour()Returns a
contour
-
contourf(X, Y, Z, *args, **kwargs) -
Create a 3D contourf plot.
Argument Description X, Y, Data values as numpy.arrays Z zdir The direction to use: x, y or z (default) offset If specified plot a projection of the filled contour on this position in plane normal to zdir The positional and keyword arguments are passed on to
contourf()Returns a
contourfChanged in version 1.1.0: The zdir and offset kwargs were added.
-
contourf3D(X, Y, Z, *args, **kwargs) -
Create a 3D contourf plot.
Argument Description X, Y, Data values as numpy.arrays Z zdir The direction to use: x, y or z (default) offset If specified plot a projection of the filled contour on this position in plane normal to zdir The positional and keyword arguments are passed on to
contourf()Returns a
contourfChanged in version 1.1.0: The zdir and offset kwargs were added.
-
convert_zunits(z) -
For artists in an axes, if the zaxis has units support, convert z using zaxis unit type
New in version 1.2.1.
-
disable_mouse_rotation() -
Disable mouse button callbacks.
-
draw(renderer)
-
format_coord(xd, yd) -
Given the 2D view coordinates attempt to guess a 3D coordinate. Looks for the nearest edge to the point and then assumes that the point is at the same z location as the nearest point on the edge.
-
format_zdata(z) -
Return z string formatted. This function will use the
fmt_zdataattribute if it is callable, else will fall back on the zaxis major formatter
-
get_autoscale_on() -
Get whether autoscaling is applied for all axes on plot commands
New in version 1.1.0: This function was added, but not tested. Please report any bugs.
-
get_autoscalez_on() -
Get whether autoscaling for the z-axis is applied on plot commands
New in version 1.1.0: This function was added, but not tested. Please report any bugs.
-
get_axis_position()
-
get_axisbelow() -
Get whether axis below is true or not.
For axes3d objects, this will always be True
New in version 1.1.0: This function was added for completeness.
-
get_children()
-
get_frame_on() -
Get whether the 3D axes panels are drawn
New in version 1.1.0.
-
get_proj() -
Create the projection matrix from the current viewing position.
elev stores the elevation angle in the z plane azim stores the azimuth angle in the x,y plane
dist is the distance of the eye viewing point from the object point.
-
get_w_lims() -
Get 3D world limits.
-
get_xlim() -
Get the x-axis range
Returns: xlimits : tuple
Returns the current x-axis limits as the tuple (
left,right).Notes
The x-axis may be inverted, in which case the
leftvalue will be greater than therightvalue.Changed in version 1.1.0: This function now correctly refers to the 3D x-limits
-
get_xlim3d() -
Get the x-axis range
Returns: xlimits : tuple
Returns the current x-axis limits as the tuple (
left,right).Notes
The x-axis may be inverted, in which case the
leftvalue will be greater than therightvalue.Changed in version 1.1.0: This function now correctly refers to the 3D x-limits
-
get_ylim() -
Get the y-axis range
Returns: ylimits : tuple
Returns the current y-axis limits as the tuple (
bottom,top).Notes
The y-axis may be inverted, in which case the
bottomvalue will be greater than thetopvalue.Changed in version 1.1.0: This function now correctly refers to the 3D y-limits.
-
get_ylim3d() -
Get the y-axis range
Returns: ylimits : tuple
Returns the current y-axis limits as the tuple (
bottom,top).Notes
The y-axis may be inverted, in which case the
bottomvalue will be greater than thetopvalue.Changed in version 1.1.0: This function now correctly refers to the 3D y-limits.
-
get_zbound() -
Returns the z-axis numerical bounds where:
lowerBound < upperBound
New in version 1.1.0: This function was added, but not tested. Please report any bugs.
-
get_zlabel() -
Get the z-label text string.
New in version 1.1.0: This function was added, but not tested. Please report any bugs.
-
get_zlim() -
Get 3D z limits.
-
get_zlim3d() -
Get 3D z limits.
-
get_zmajorticklabels() -
Get the ztick labels as a list of Text instances
New in version 1.1.0.
-
get_zminorticklabels() -
Get the ztick labels as a list of Text instances
Note
Minor ticks are not supported. This function was added only for completeness.
New in version 1.1.0.
-
get_zscale()
-
get_zticklabels(minor=False) -
Get ztick labels as a list of Text instances. See
matplotlib.axes.Axes.get_yticklabels()for more details.Note
Minor ticks are not supported.
New in version 1.1.0.
-
get_zticklines() -
Get ztick lines as a list of Line2D instances. Note that this function is provided merely for completeness. These lines are re-calculated as the display changes.
New in version 1.1.0.
-
get_zticks(minor=False) -
Return the z ticks as a list of locations See
matplotlib.axes.Axes.get_yticks()for more details.Note
Minor ticks are not supported.
New in version 1.1.0.
-
grid(b=True, **kwargs) -
Set / unset 3D grid.
Note
Currently, this function does not behave the same as
matplotlib.axes.Axes.grid(), but it is intended to eventually support that behavior.Changed in version 1.1.0: This function was changed, but not tested. Please report any bugs.
-
have_units() -
Return True if units are set on the x, y, or z axes
-
invert_zaxis() -
Invert the z-axis.
New in version 1.1.0: This function was added, but not tested. Please report any bugs.
-
locator_params(axis='both', tight=None, **kwargs) -
Convenience method for controlling tick locators.
See
matplotlib.axes.Axes.locator_params()for full documentation Note that this is for Axes3D objects, therefore, setting axis to ‘both’ will result in the parameters being set for all three axes. Also, axis can also take a value of ‘z’ to apply parameters to the z axis.New in version 1.1.0: This function was added, but not tested. Please report any bugs.
-
margins(*args, **kw) -
Convenience method to set or retrieve autoscaling margins.
- signatures::
- margins()
returns xmargin, ymargin, zmargin
margins(margin)

margins(xmargin, ymargin, zmargin)

margins(x=xmargin, y=ymargin, z=zmargin)

margins(..., tight=False)
All forms above set the xmargin, ymargin and zmargin parameters. All keyword parameters are optional. A single argument specifies xmargin, ymargin and zmargin. The tight parameter is passed to
autoscale_view(), which is executed after a margin is changed; the default here is True, on the assumption that when margins are specified, no additional padding to match tick marks is usually desired. Setting tight to None will preserve the previous setting.Specifying any margin changes only the autoscaling; for example, if xmargin is not None, then xmargin times the X data interval will be added to each end of that interval before it is used in autoscaling.
New in version 1.1.0: This function was added, but not tested. Please report any bugs.
-
mouse_init(rotate_btn=1, zoom_btn=3) -
Initializes mouse button callbacks to enable 3D rotation of the axes. Also optionally sets the mouse buttons for 3D rotation and zooming.
Argument Description rotate_btn The integer or list of integers specifying which mouse button or buttons to use for 3D rotation of the axes. Default = 1. zoom_btn The integer or list of integers specifying which mouse button or buttons to use to zoom the 3D axes. Default = 3.
-
name = '3d'
-
plot(xs, ys, *args, **kwargs) -
Plot 2D or 3D data.
Argument Description xs, ys x, y coordinates of vertices zs z value(s), either one for all points or one for each point. zdir Which direction to use as z (‘x’, ‘y’ or ‘z’) when plotting a 2D set. Other arguments are passed on to
plot()
-
plot3D(xs, ys, *args, **kwargs) -
Plot 2D or 3D data.
Argument Description xs, ys x, y coordinates of vertices zs z value(s), either one for all points or one for each point. zdir Which direction to use as z (‘x’, ‘y’ or ‘z’) when plotting a 2D set. Other arguments are passed on to
plot()
-
plot_surface(X, Y, Z, *args, **kwargs) -
Create a surface plot.
By default it will be colored in shades of a solid color, but it also supports color mapping by supplying the cmap argument.
The
rstrideandcstridekwargs set the stride used to sample the input data to generate the graph. If 1k by 1k arrays are passed in, the default values for the strides will result in a 100x100 grid being plotted. Defaults to 10. Raises a ValueError if both stride and count kwargs (see next section) are provided.The
rcountandccountkwargs supersedesrstrideandcstridefor default sampling method for surface plotting. These arguments will determine at most how many evenly spaced samples will be taken from the input data to generate the graph. This is the default sampling method unless using the ‘classic’ style. Will raise ValueError if both stride and count are specified. Added in v2.0.0.Argument Description X, Y, Z Data values as 2D arrays rstride Array row stride (step size) cstride Array column stride (step size) rcount Use at most this many rows, defaults to 50 ccount Use at most this many columns, defaults to 50 color Color of the surface patches cmap A colormap for the surface patches. facecolors Face colors for the individual patches norm An instance of Normalize to map values to colors vmin Minimum value to map vmax Maximum value to map shade Whether to shade the facecolors Other arguments are passed on to
Poly3DCollection
-
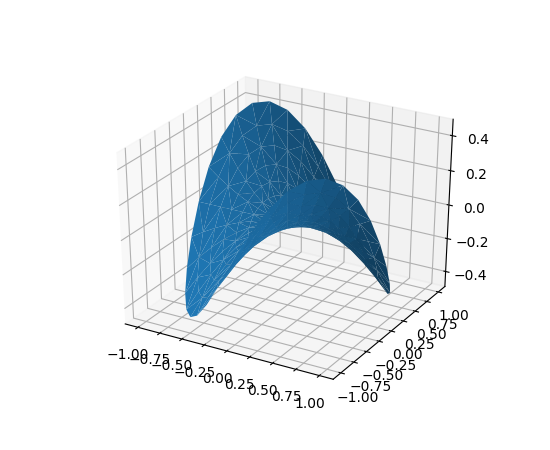
plot_trisurf(*args, **kwargs) -
Argument Description X, Y, Z Data values as 1D arrays color Color of the surface patches cmap A colormap for the surface patches. norm An instance of Normalize to map values to colors vmin Minimum value to map vmax Maximum value to map shade Whether to shade the facecolors The (optional) triangulation can be specified in one of two ways; either:
plot_trisurf(triangulation, ...)
where triangulation is a
Triangulationobject, or:plot_trisurf(X, Y, ...) plot_trisurf(X, Y, triangles, ...) plot_trisurf(X, Y, triangles=triangles, ...)
in which case a Triangulation object will be created. See
Triangulationfor a explanation of these possibilities.The remaining arguments are:
plot_trisurf(..., Z)
where Z is the array of values to contour, one per point in the triangulation.
Other arguments are passed on to
Poly3DCollectionExamples:
(Source code, png, pdf)

(Source code, png, pdf)

New in version 1.2.0: This plotting function was added for the v1.2.0 release.
-
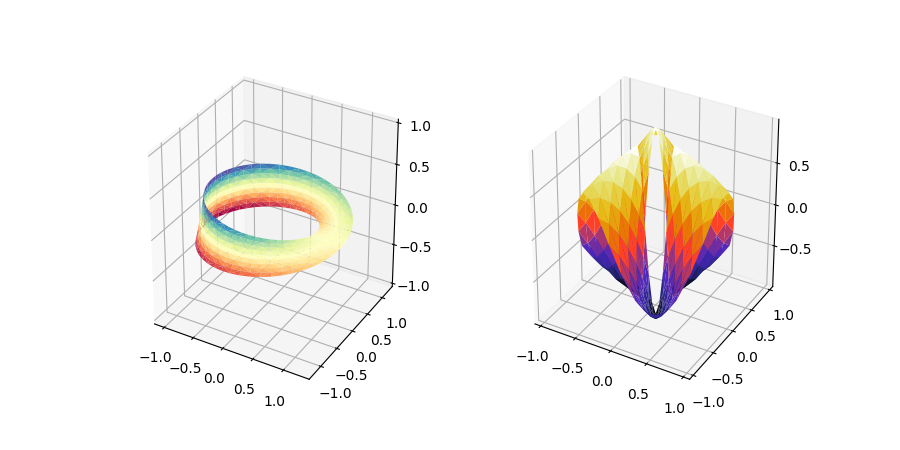
plot_wireframe(X, Y, Z, *args, **kwargs) -
Plot a 3D wireframe.
The
rstrideandcstridekwargs set the stride used to sample the input data to generate the graph. If either is 0 the input data in not sampled along this direction producing a 3D line plot rather than a wireframe plot. The stride arguments are only used by default if in the ‘classic’ mode. They are now superseded byrcountandccount. Will raise ValueError if both stride and count are used.-
` The rcount and ccount kwargs supersedes rstride and -
cstridefor default sampling method for wireframe plotting. These arguments will determine at most how many evenly spaced samples will be taken from the input data to generate the graph. This is the default sampling method unless using the ‘classic’ style. Will raise ValueError if both stride and count are specified. If either is zero, then the input data is not sampled along this direction, producing a 3D line plot rather than a wireframe plot. Added in v2.0.0.Argument Description X, Y, Data values as 2D arrays Z rstride Array row stride (step size), defaults to 1 cstride Array column stride (step size), defaults to 1 rcount Use at most this many rows, defaults to 50 ccount Use at most this many columns, defaults to 50 Keyword arguments are passed on to
LineCollection.Returns a
Line3DCollection
-
-
quiver(*args, **kwargs) -
Plot a 3D field of arrows.
call signatures:
quiver(X, Y, Z, U, V, W, **kwargs)
Arguments:
- X, Y, Z:
- The x, y and z coordinates of the arrow locations (default is tail of arrow; see pivot kwarg)
- U, V, W:
- The x, y and z components of the arrow vectors
The arguments could be array-like or scalars, so long as they they can be broadcast together. The arguments can also be masked arrays. If an element in any of argument is masked, then that corresponding quiver element will not be plotted.
Keyword arguments:
- length: [1.0 | float]
- The length of each quiver, default to 1.0, the unit is the same with the axes
- arrow_length_ratio: [0.3 | float]
- The ratio of the arrow head with respect to the quiver, default to 0.3
- pivot: [ ‘tail’ | ‘middle’ | ‘tip’ ]
- The part of the arrow that is at the grid point; the arrow rotates about this point, hence the name pivot. Default is ‘tail’
- normalize: [False | True]
- When True, all of the arrows will be the same length. This defaults to False, where the arrows will be different lengths depending on the values of u,v,w.
Any additional keyword arguments are delegated to
LineCollection
-
quiver3D(*args, **kwargs) -
Plot a 3D field of arrows.
call signatures:
quiver(X, Y, Z, U, V, W, **kwargs)
Arguments:
- X, Y, Z:
- The x, y and z coordinates of the arrow locations (default is tail of arrow; see pivot kwarg)
- U, V, W:
- The x, y and z components of the arrow vectors
The arguments could be array-like or scalars, so long as they they can be broadcast together. The arguments can also be masked arrays. If an element in any of argument is masked, then that corresponding quiver element will not be plotted.
Keyword arguments:
- length: [1.0 | float]
- The length of each quiver, default to 1.0, the unit is the same with the axes
- arrow_length_ratio: [0.3 | float]
- The ratio of the arrow head with respect to the quiver, default to 0.3
- pivot: [ ‘tail’ | ‘middle’ | ‘tip’ ]
- The part of the arrow that is at the grid point; the arrow rotates about this point, hence the name pivot. Default is ‘tail’
- normalize: [False | True]
- When True, all of the arrows will be the same length. This defaults to False, where the arrows will be different lengths depending on the values of u,v,w.
Any additional keyword arguments are delegated to
LineCollection
-
scatter(xs, ys, zs=0, zdir='z', s=20, c=None, depthshade=True, *args, **kwargs) -
Create a scatter plot.
Argument Description xs, ys Positions of data points. zs Either an array of the same length as xs and ys or a single value to place all points in the same plane. Default is 0. zdir Which direction to use as z (‘x’, ‘y’ or ‘z’) when plotting a 2D set. s Size in points^2. It is a scalar or an array of the same length as x and y. c A color. c can be a single color format string, or a sequence of color specifications of length N, or a sequence of N numbers to be mapped to colors using the cmap and norm specified via kwargs (see below). Note that c should not be a single numeric RGB or RGBA sequence because that is indistinguishable from an array of values to be colormapped. c can be a 2-D array in which the rows are RGB or RGBA, however, including the case of a single row to specify the same color for all points. depthshade Whether or not to shade the scatter markers to give the appearance of depth. Default is True. Keyword arguments are passed on to
scatter().Returns a
Patch3DCollection
-
scatter3D(xs, ys, zs=0, zdir='z', s=20, c=None, depthshade=True, *args, **kwargs) -
Create a scatter plot.
Argument Description xs, ys Positions of data points. zs Either an array of the same length as xs and ys or a single value to place all points in the same plane. Default is 0. zdir Which direction to use as z (‘x’, ‘y’ or ‘z’) when plotting a 2D set. s Size in points^2. It is a scalar or an array of the same length as x and y. c A color. c can be a single color format string, or a sequence of color specifications of length N, or a sequence of N numbers to be mapped to colors using the cmap and norm specified via kwargs (see below). Note that c should not be a single numeric RGB or RGBA sequence because that is indistinguishable from an array of values to be colormapped. c can be a 2-D array in which the rows are RGB or RGBA, however, including the case of a single row to specify the same color for all points. depthshade Whether or not to shade the scatter markers to give the appearance of depth. Default is True. Keyword arguments are passed on to
scatter().Returns a
Patch3DCollection
-
set_autoscale_on(b) -
Set whether autoscaling is applied on plot commands
accepts: [ True | False ]
New in version 1.1.0: This function was added, but not tested. Please report any bugs.
-
set_autoscalez_on(b) -
Set whether autoscaling for the z-axis is applied on plot commands
accepts: [ True | False ]
New in version 1.1.0: This function was added, but not tested. Please report any bugs.
-
set_axis_off()
-
set_axis_on()
-
set_axisbelow(b) -
Set whether the axis ticks and gridlines are above or below most artists
For axes3d objects, this will ignore any settings and just use True
ACCEPTS: [ True | False ]
New in version 1.1.0: This function was added for completeness.
-
set_frame_on(b) -
Set whether the 3D axes panels are drawn
ACCEPTS: [ True | False ]
New in version 1.1.0.
-
set_proj_type(proj_type) -
Set the projection type.
Parameters: proj_type : str
Type of projection, accepts ‘persp’ and ‘ortho’.
-
set_title(label, fontdict=None, loc='center', **kwargs) -
Set a title for the axes.
Set one of the three available axes titles. The available titles are positioned above the axes in the center, flush with the left edge, and flush with the right edge.
Parameters: label : str
Text to use for the title
fontdict : dict
A dictionary controlling the appearance of the title text, the default
fontdictis:{'fontsize': rcParams['axes.titlesize'], 'fontweight' : rcParams['axes.titleweight'], 'verticalalignment': 'baseline', 'horizontalalignment': loc}loc : {‘center’, ‘left’, ‘right’}, str, optional
Which title to set, defaults to ‘center’
Returns: text :
TextThe matplotlib text instance representing the title
Other Parameters: **kwargs :
TextpropertiesOther keyword arguments are text properties, see
Textfor a list of valid text properties.
-
set_top_view()
-
set_xlim(left=None, right=None, emit=True, auto=False, **kw) -
Set 3D x limits.
See
matplotlib.axes.Axes.set_xlim()for full documentation.
-
set_xlim3d(left=None, right=None, emit=True, auto=False, **kw) -
Set 3D x limits.
See
matplotlib.axes.Axes.set_xlim()for full documentation.
-
set_xscale(value, **kwargs) -
Set the x-axis scale
Parameters: value : {“linear”, “log”, “symlog”, “logit”}
scaling strategy to apply
See also
-
matplotlib.scale.LinearScale - linear transfrom
-
matplotlib.scale.LogTransform - log transform
-
matplotlib.scale.SymmetricalLogTransform - symlog transform
-
matplotlib.scale.LogisticTransform - logit transform .. versionadded :: 1.1.0 This function was added, but not tested. Please report any bugs.
Notes
Different kwargs are accepted, depending on the scale. See the
scalemodule for more information. -
-
set_ylim(bottom=None, top=None, emit=True, auto=False, **kw) -
Set 3D y limits.
See
matplotlib.axes.Axes.set_ylim()for full documentation.
-
set_ylim3d(bottom=None, top=None, emit=True, auto=False, **kw) -
Set 3D y limits.
See
matplotlib.axes.Axes.set_ylim()for full documentation.
-
set_yscale(value, **kwargs) -
Set the y-axis scale
Parameters: value : {“linear”, “log”, “symlog”, “logit”}
scaling strategy to apply
See also
-
matplotlib.scale.LinearScale - linear transfrom
-
matplotlib.scale.LogTransform - log transform
-
matplotlib.scale.SymmetricalLogTransform - symlog transform
-
matplotlib.scale.LogisticTransform - logit transform .. versionadded :: 1.1.0 This function was added, but not tested. Please report any bugs.
Notes
Different kwargs are accepted, depending on the scale. See the
scalemodule for more information. -
-
set_zbound(lower=None, upper=None) -
Set the lower and upper numerical bounds of the z-axis. This method will honor axes inversion regardless of parameter order. It will not change the
_autoscaleZonattribute.New in version 1.1.0: This function was added, but not tested. Please report any bugs.
-
set_zlabel(zlabel, fontdict=None, labelpad=None, **kwargs) -
Set zlabel. See doc for
set_ylabel()for description.
-
set_zlim(bottom=None, top=None, emit=True, auto=False, **kw) -
Set 3D z limits.
See
matplotlib.axes.Axes.set_ylim()for full documentation
-
set_zlim3d(bottom=None, top=None, emit=True, auto=False, **kw) -
Set 3D z limits.
See
matplotlib.axes.Axes.set_ylim()for full documentation
-
set_zmargin(m) -
Set padding of Z data limits prior to autoscaling.
m times the data interval will be added to each end of that interval before it is used in autoscaling.
accepts: float in range 0 to 1
New in version 1.1.0: This function was added, but not tested. Please report any bugs.
-
set_zscale(value, **kwargs) -
Set the scaling of the z-axis: ‘linear’ | ‘log’ | ‘logit’ | ‘symlog’
ACCEPTS: [‘linear’ | ‘log’ | ‘logit’ | ‘symlog’]
- Different kwargs are accepted, depending on the scale:
-
‘linear’
‘log’
- basex/basey:
- The base of the logarithm
- nonposx/nonposy: [‘mask’ | ‘clip’ ]
- non-positive values in x or y can be masked as invalid, or clipped to a very small positive number
- subsx/subsy:
-
Where to place the subticks between each major tick. Should be a sequence of integers. For example, in a log10 scale:
[2, 3, 4, 5, 6, 7, 8, 9]will place 8 logarithmically spaced minor ticks between each major tick.
‘logit’
- nonpos: [‘mask’ | ‘clip’ ]
- values beyond ]0, 1[ can be masked as invalid, or clipped to a number very close to 0 or 1
‘symlog’
- basex/basey:
- The base of the logarithm
- linthreshx/linthreshy:
- A single float which defines the range (-x, x), within which the plot is linear. This avoids having the plot go to infinity around zero.
- subsx/subsy:
-
Where to place the subticks between each major tick. Should be a sequence of integers. For example, in a log10 scale:
[2, 3, 4, 5, 6, 7, 8, 9]will place 8 logarithmically spaced minor ticks between each major tick.
- linscalex/linscaley:
- This allows the linear range (-linthresh to linthresh) to be stretched relative to the logarithmic range. Its value is the number of decades to use for each half of the linear range. For example, when linscale == 1.0 (the default), the space used for the positive and negative halves of the linear range will be equal to one decade in the logarithmic range.
Note
Currently, Axes3D objects only supports linear scales. Other scales may or may not work, and support for these is improving with each release.
New in version 1.1.0: This function was added, but not tested. Please report any bugs.
-
set_zticklabels(*args, **kwargs) -
Set z-axis tick labels. See
matplotlib.axes.Axes.set_yticklabels()for more details.Note
Minor ticks are not supported by Axes3D objects.
New in version 1.1.0.
-
set_zticks(*args, **kwargs) -
Set z-axis tick locations. See
matplotlib.axes.Axes.set_yticks()for more details.Note
Minor ticks are not supported.
New in version 1.1.0.
-
text(x, y, z, s, zdir=None, **kwargs) -
Add text to the plot. kwargs will be passed on to Axes.text, except for the
zdirkeyword, which sets the direction to be used as the z direction.
-
text2D(x, y, s, fontdict=None, withdash=False, **kwargs) -
Add text to the axes.
Add text in string
sto axis at locationx,y, data coordinates.Parameters: x, y : scalars
data coordinates
s : string
text
fontdict : dictionary, optional, default: None
A dictionary to override the default text properties. If fontdict is None, the defaults are determined by your rc parameters.
withdash : boolean, optional, default: False
Creates a
TextWithDashinstance instead of aTextinstance.Other Parameters: **kwargs :
Textproperties.Other miscellaneous text parameters.
Examples
Individual keyword arguments can be used to override any given parameter:
>>> text(x, y, s, fontsize=12)
The default transform specifies that text is in data coords, alternatively, you can specify text in axis coords (0,0 is lower-left and 1,1 is upper-right). The example below places text in the center of the axes:
>>> text(0.5, 0.5,'matplotlib', horizontalalignment='center',
...      verticalalignment='center',
...      transform=ax.transAxes)
You can put a rectangular box around the text instance (e.g., to set a background color) by using the keyword
bbox.bboxis a dictionary ofRectangleproperties. For example:>>> text(x, y, s, bbox=dict(facecolor='red', alpha=0.5))
-
text3D(x, y, z, s, zdir=None, **kwargs) -
Add text to the plot. kwargs will be passed on to Axes.text, except for the
zdirkeyword, which sets the direction to be used as the z direction.
-
tick_params(axis='both', **kwargs) -
Convenience method for changing the appearance of ticks and tick labels.
See
matplotlib.axes.Axes.tick_params()for more complete documentation.The only difference is that setting axis to ‘both’ will mean that the settings are applied to all three axes. Also, the axis parameter also accepts a value of ‘z’, which would mean to apply to only the z-axis.
Also, because of how Axes3D objects are drawn very differently from regular 2D axes, some of these settings may have ambiguous meaning. For simplicity, the ‘z’ axis will accept settings as if it was like the ‘y’ axis.
Note
While this function is currently implemented, the core part of the Axes3D object may ignore some of these settings. Future releases will fix this. Priority will be given to those who file bugs.
New in version 1.1.0: This function was added, but not tested. Please report any bugs.
-
ticklabel_format(**kwargs) -
Convenience method for manipulating the ScalarFormatter used by default for linear axes in Axed3D objects.
See
matplotlib.axes.Axes.ticklabel_format()for full documentation. Note that this version applies to all three axes of the Axes3D object. Therefore, the axis argument will also accept a value of ‘z’ and the value of ‘both’ will apply to all three axes.New in version 1.1.0: This function was added, but not tested. Please report any bugs.
-
tricontour(*args, **kwargs) -
Create a 3D contour plot.
Argument Description X, Y, Data values as numpy.arrays Z extend3d Whether to extend contour in 3D (default: False) stride Stride (step size) for extending contour zdir The direction to use: x, y or z (default) offset If specified plot a projection of the contour lines on this position in plane normal to zdir Other keyword arguments are passed on to
tricontour()Returns a
contourChanged in version 1.3.0: Added support for custom triangulations
EXPERIMENTAL: This method currently produces incorrect output due to a longstanding bug in 3D PolyCollection rendering.
-
tricontourf(*args, **kwargs) -
Create a 3D contourf plot.
Argument Description X, Y, Data values as numpy.arrays Z zdir The direction to use: x, y or z (default) offset If specified plot a projection of the contour lines on this position in plane normal to zdir Other keyword arguments are passed on to
tricontour()Returns a
contourChanged in version 1.3.0: Added support for custom triangulations
EXPERIMENTAL: This method currently produces incorrect output due to a longstanding bug in 3D PolyCollection rendering.
-
tunit_cube(vals=None, M=None)
-
tunit_edges(vals=None, M=None)
-
unit_cube(vals=None)
-
update_datalim(xys, **kwargs)
-
view_init(elev=None, azim=None) -
Set the elevation and azimuth of the axes.
This can be used to rotate the axes programatically.
‘elev’ stores the elevation angle in the z plane. ‘azim’ stores the azimuth angle in the x,y plane.
if elev or azim are None (default), then the initial value is used which was specified in the
Axes3Dconstructor.
-
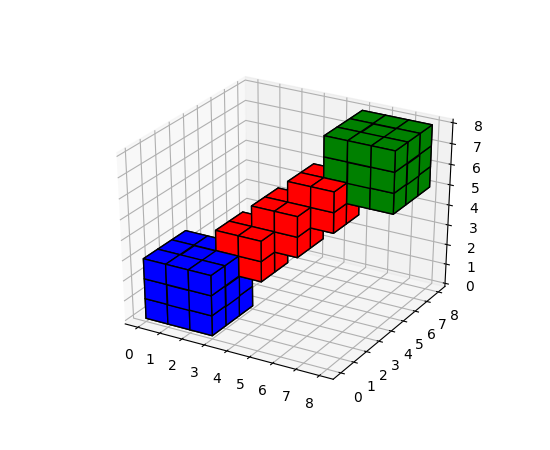
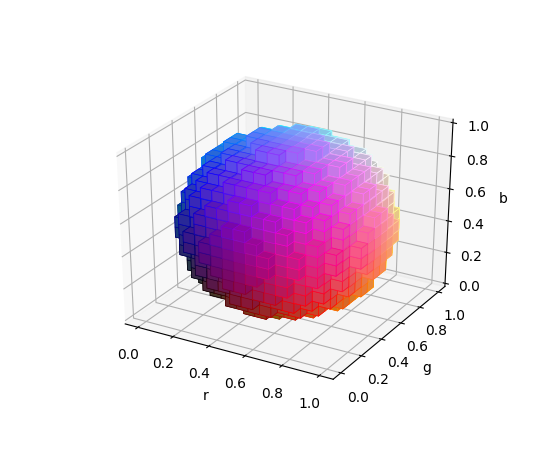
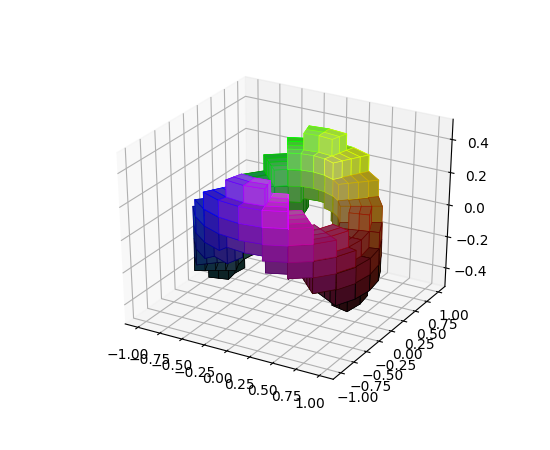
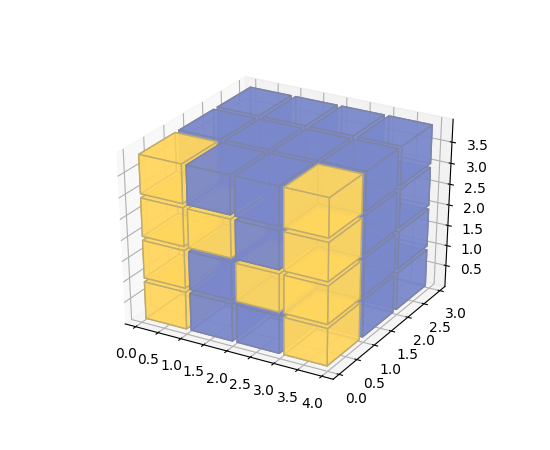
voxels([x, y, z, ]/, filled, **kwargs) -
Plot a set of filled voxels
All voxels are plotted as 1x1x1 cubes on the axis, with filled[0,0,0] placed with its lower corner at the origin. Occluded faces are not plotted.
Call signatures:
voxels(filled, facecolors=fc, edgecolors=ec, **kwargs)
voxels(x, y, z, filled, facecolors=fc, edgecolors=ec, **kwargs)
New in version 2.1.
Parameters: filled : 3D np.array of bool
A 3d array of values, with truthy values indicating which voxels to fill
x, y, z : 3D np.array, optional
The coordinates of the corners of the voxels. This should broadcast to a shape one larger in every dimension than the shape of
filled. These can be used to plot non-cubic voxels.If not specified, defaults to increasing integers along each axis, like those returned by
indices(). As indicated by the/in the function signature, these arguments can only be passed positionally.facecolors, edgecolors : array_like, optional
The color to draw the faces and edges of the voxels. Can only be passed as keyword arguments. This parameter can be:
- A single color value, to color all voxels the same color. This can be either a string, or a 1D rgb/rgba array
-
None, the default, to use a single color for the faces, and the style default for the edges. - A 3D ndarray of color names, with each item the color for the corresponding voxel. The size must match the voxels.
- A 4D ndarray of rgb/rgba data, with the components along the last axis.
**kwargs
Additional keyword arguments to pass onto
Poly3DCollection()Returns: faces : dict
A dictionary indexed by coordinate, where
faces[i,j,k]is aPoly3DCollectionof the faces drawn for the voxelfilled[i,j,k]. If no faces were drawn for a given voxel, either because it was not asked to be drawn, or it is fully occluded, then(i,j,k) not in faces.Examples
(Source code, png, pdf)

(Source code, png, pdf)

(Source code, png, pdf)

(Source code, png, pdf)

-
zaxis_date(tz=None) -
Sets up z-axis ticks and labels that treat the z data as dates.
tz is a timezone string or
tzinfoinstance. Defaults to rc value.Note
This function is merely provided for completeness. Axes3D objects do not officially support dates for ticks, and so this may or may not work as expected.
New in version 1.1.0: This function was added, but not tested. Please report any bugs.
-
zaxis_inverted() -
Returns True if the z-axis is inverted.
New in version 1.1.0: This function was added, but not tested. Please report any bugs.
-
© 2012–2017 Matplotlib Development Team. All rights reserved.
Licensed under the Matplotlib License Agreement.
http://matplotlib.org/2.1.0/api/_as_gen/mpl_toolkits.mplot3d.axes3d.Axes3D.html