matplotlib.axes.Axes.eventplot
-
Axes.eventplot(positions, orientation='horizontal', lineoffsets=1, linelengths=1, linewidths=None, colors=None, linestyles='solid', **kwargs) -
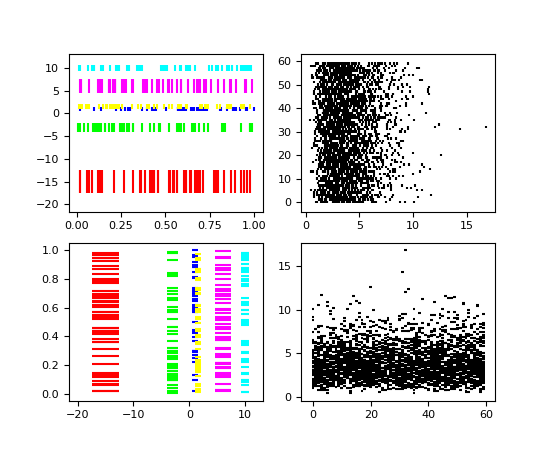
Plot identical parallel lines at specific positions.
Plot parallel lines at the given positions. positions should be a 1D or 2D array-like object, with each row corresponding to a row or column of lines.
This type of plot is commonly used in neuroscience for representing neural events, where it is commonly called a spike raster, dot raster, or raster plot.
However, it is useful in any situation where you wish to show the timing or position of multiple sets of discrete events, such as the arrival times of people to a business on each day of the month or the date of hurricanes each year of the last century.
-
orientation : [ ‘horizontal’ | ‘vertical’ ] - ‘horizontal’ : the lines will be vertical and arranged in rows ‘vertical’ : lines will be horizontal and arranged in columns
- lineoffsets :
- A float or array-like containing floats.
- linelengths :
- A float or array-like containing floats.
- linewidths :
- A float or array-like containing floats.
- colors
- must be a sequence of RGBA tuples (e.g., arbitrary color strings, etc, not allowed) or a list of such sequences
- linestyles :
- [ ‘solid’ | ‘dashed’ | ‘dashdot’ | ‘dotted’ ] or an array of these values
For linelengths, linewidths, colors, and linestyles, if only a single value is given, that value is applied to all lines. If an array-like is given, it must have the same length as positions, and each value will be applied to the corresponding row or column in positions.
Returns a list of
matplotlib.collections.EventCollectionobjects that were added.kwargs are
LineCollectionproperties:Property Description agg_filterunknown alphafloat or None animated[True | False] antialiasedor antialiasedsBoolean or sequence of booleans arrayunknown axesan Axesinstanceclima length 2 sequence of floats clip_boxa matplotlib.transforms.Bboxinstanceclip_on[True | False] clip_path[ ( Path,Transform) |Patch| None ]cmapa colormap or registered colormap name colormatplotlib color arg or sequence of rgba tuples containsa callable function edgecoloror edgecolorsmatplotlib color spec or sequence of specs facecoloror facecolorsmatplotlib color spec or sequence of specs figurea matplotlib.figure.Figureinstancegidan id string hatch[ ‘/’ | ‘\’ | ‘|’ | ‘-‘ | ‘+’ | ‘x’ | ‘o’ | ‘O’ | ‘.’ | ‘*’ ] labelstring or anything printable with ‘%s’ conversion. linestyleor dashes or linestyles[‘solid’ | ‘dashed’, ‘dashdot’, ‘dotted’ | (offset, on-off-dash-seq) | '-'|'--'|'-.'|':'|'None'|' '|'']linewidthor linewidths or lwfloat or sequence of floats normunknown offset_positionunknown offsetsfloat or sequence of floats path_effectsunknown pathsunknown picker[None|float|boolean|callable] pickradiusunknown rasterized[True | False | None] segmentsunknown sketch_paramsunknown snapunknown transformTransforminstanceurla url string urlsunknown vertsunknown visible[True | False] zorderany number Example:
(Source code, png, pdf)

Note
In addition to the above described arguments, this function can take a data keyword argument. If such a data argument is given, the following arguments are replaced by data[<arg>]:
- All arguments with the following names: ‘colors’, ‘linelengths’, ‘lineoffsets’, ‘linestyles’, ‘linewidths’, ‘positions’.
-
© 2012–2017 Matplotlib Development Team. All rights reserved.
Licensed under the Matplotlib License Agreement.
http://matplotlib.org/2.0.2/api/_as_gen/matplotlib.axes.Axes.eventplot.html