matplotlib.axes.Axes.hlines
-
Axes.hlines(y, xmin, xmax, colors='k', linestyles='solid', label='', **kwargs) -
Plot horizontal lines at each
yfromxmintoxmax.Parameters: y : scalar or sequence of scalar
y-indexes where to plot the lines.
xmin, xmax : scalar or 1D array_like
Respective beginning and end of each line. If scalars are provided, all lines will have same length.
colors : array_like of colors, optional, default: ‘k’
linestyles : [‘solid’ | ‘dashed’ | ‘dashdot’ | ‘dotted’], optional
label : string, optional, default: ‘’
Returns: lines :
LineCollectionOther Parameters: kwargs :
LineCollectionproperties.See also
-
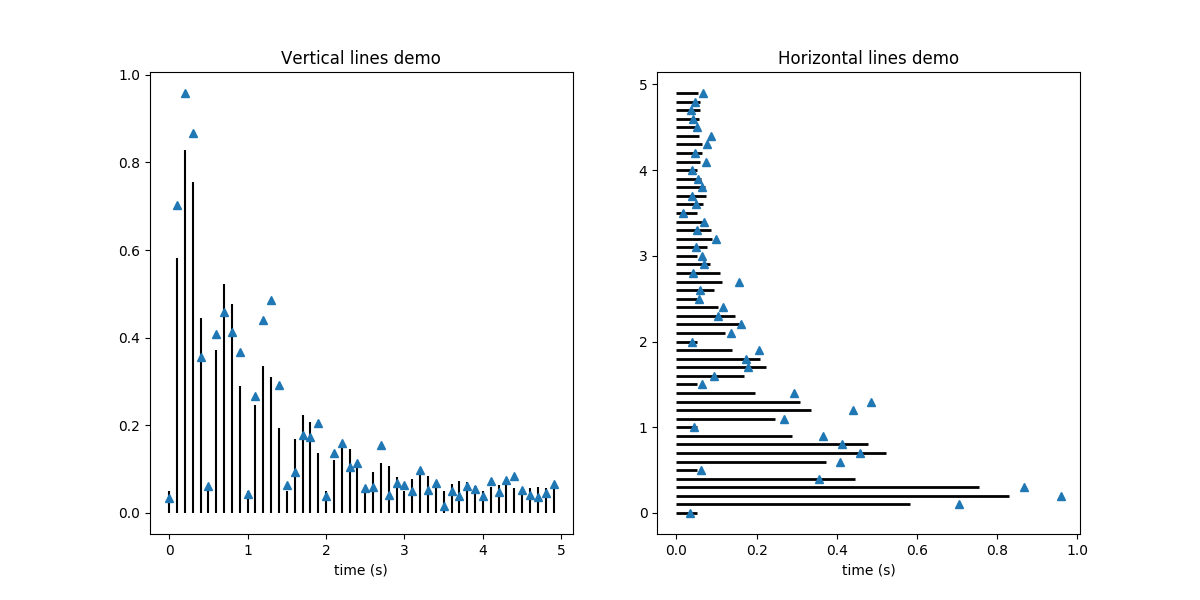
vlines - vertical lines
Examples
(Source code, png, pdf)
Note
In addition to the above described arguments, this function can take a data keyword argument. If such a data argument is given, the following arguments are replaced by data[<arg>]:
- All arguments with the following names: ‘xmax’, ‘xmin’, ‘y’.
-
© 2012–2017 Matplotlib Development Team. All rights reserved.
Licensed under the Matplotlib License Agreement.
http://matplotlib.org/2.0.2/api/_as_gen/matplotlib.axes.Axes.hlines.html