matplotlib.axes.Axes.fill_between
-
Axes.fill_between(x, y1, y2=0, where=None, interpolate=False, step=None, **kwargs) -
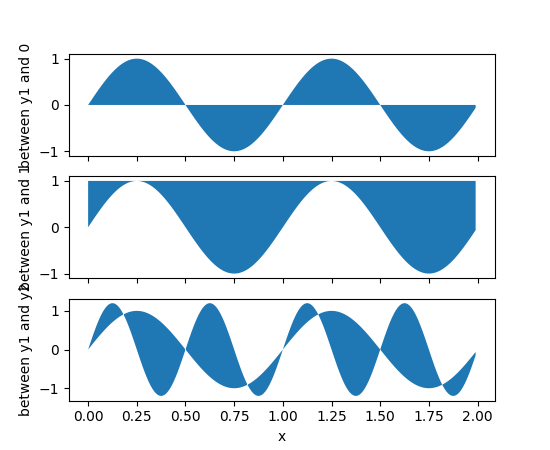
Make filled polygons between two curves.
Create a
PolyCollectionfilling the regions between y1 and y2 wherewhere==TrueParameters: x : array
An N-length array of the x data
y1 : array
An N-length array (or scalar) of the y data
y2 : array
An N-length array (or scalar) of the y data
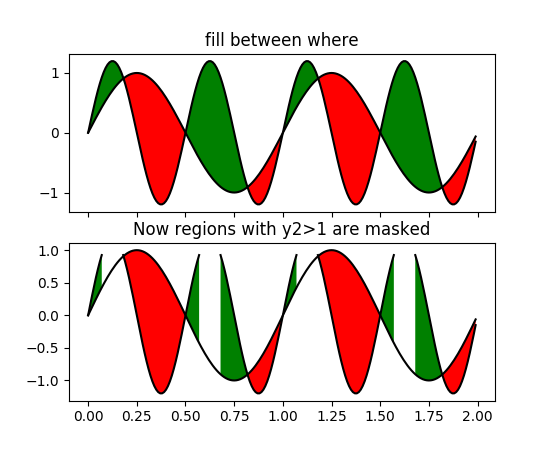
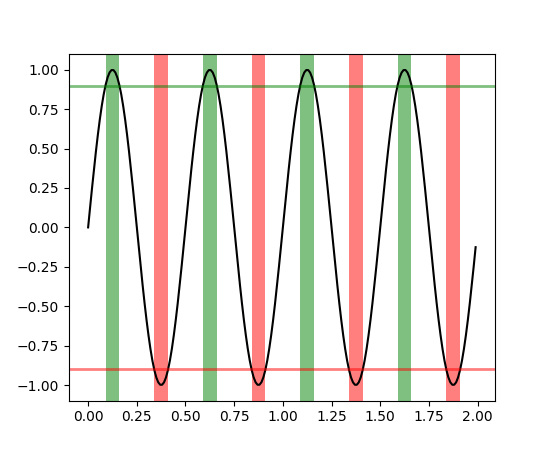
where : array, optional
If
None, default to fill between everywhere. If notNone, it is an N-length numpy boolean array and the fill will only happen over the regions wherewhere==True.interpolate : bool, optional
If
True, interpolate between the two lines to find the precise point of intersection. Otherwise, the start and end points of the filled region will only occur on explicit values in the x array.step : {‘pre’, ‘post’, ‘mid’}, optional
If not None, fill with step logic.
See also
- In addition to the above described arguments, this function can take a data keyword argument. If such a data argument is given, the following arguments are replaced by data[<arg>]: * All arguments with the following names: ‘where’, ‘x’, ‘y1’, ‘y2’.
Notes
Additional Keyword args passed on to the
PolyCollection.kwargs control the
Polygonproperties:Property Description agg_filterunknown alphafloat or None animated[True | False] antialiasedor antialiasedsBoolean or sequence of booleans arrayunknown axesan Axesinstanceclima length 2 sequence of floats clip_boxa matplotlib.transforms.Bboxinstanceclip_on[True | False] clip_path[ ( Path,Transform) |Patch| None ]cmapa colormap or registered colormap name colormatplotlib color arg or sequence of rgba tuples containsa callable function edgecoloror edgecolorsmatplotlib color spec or sequence of specs facecoloror facecolorsmatplotlib color spec or sequence of specs figurea matplotlib.figure.Figureinstancegidan id string hatch[ ‘/’ | ‘\’ | ‘|’ | ‘-‘ | ‘+’ | ‘x’ | ‘o’ | ‘O’ | ‘.’ | ‘*’ ] labelstring or anything printable with ‘%s’ conversion. linestyleor dashes or linestyles[‘solid’ | ‘dashed’, ‘dashdot’, ‘dotted’ | (offset, on-off-dash-seq) | '-'|'--'|'-.'|':'|'None'|' '|'']linewidthor linewidths or lwfloat or sequence of floats normunknown offset_positionunknown offsetsfloat or sequence of floats path_effectsunknown picker[None|float|boolean|callable] pickradiusunknown rasterized[True | False | None] sketch_paramsunknown snapunknown transformTransforminstanceurla url string urlsunknown visible[True | False] zorderany number Examples

© 2012–2017 Matplotlib Development Team. All rights reserved.
Licensed under the Matplotlib License Agreement.
http://matplotlib.org/2.0.2/api/_as_gen/matplotlib.axes.Axes.fill_between.html