matplotlib.axes.Axes.triplot
-
Axes.triplot(*args, **kwargs) -
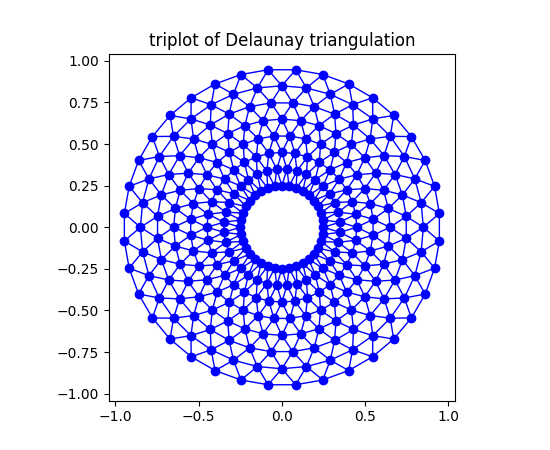
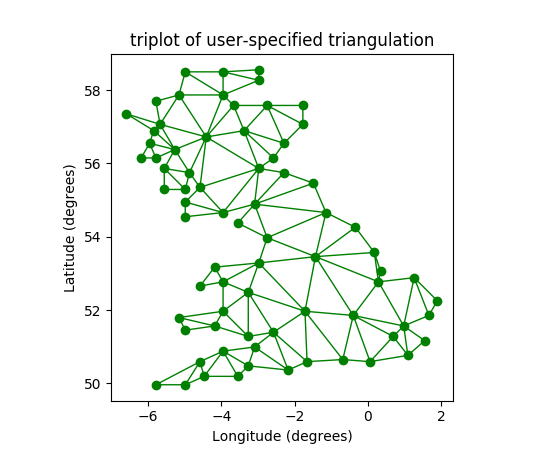
Draw a unstructured triangular grid as lines and/or markers.
The triangulation to plot can be specified in one of two ways; either:
triplot(triangulation, ...)
where triangulation is a
matplotlib.tri.Triangulationobject, ortriplot(x, y, ...) triplot(x, y, triangles, ...) triplot(x, y, triangles=triangles, ...) triplot(x, y, mask=mask, ...) triplot(x, y, triangles, mask=mask, ...)
in which case a Triangulation object will be created. See
Triangulationfor a explanation of these possibilities.The remaining args and kwargs are the same as for
plot().Return a list of 2
Line2Dcontaining respectively:- the lines plotted for triangles edges
- the markers plotted for triangles nodes
Example:


© 2012–2017 Matplotlib Development Team. All rights reserved.
Licensed under the Matplotlib License Agreement.
http://matplotlib.org/2.0.2/api/_as_gen/matplotlib.axes.Axes.triplot.html