matplotlib.axes.Axes.fill
-
Axes.fill(*args, **kwargs) -
Plot filled polygons.
Parameters: args : a variable length argument
It allowing for multiple x, y pairs with an optional color format string; see
plot()for details on the argument parsing. For example, each of the following is legal:ax.fill(x, y) ax.fill(x, y, "b") ax.fill(x, y, "b", x, y, "r")
An arbitrary number of x, y, color groups can be specified:: ax.fill(x1, y1, ‘g’, x2, y2, ‘r’)
Returns: a list of
PatchOther Parameters: kwargs :
PolygonpropertiesNotes
The same color strings that
plot()supports are supported by the fill format string.If you would like to fill below a curve, e.g., shade a region between 0 and y along x, use
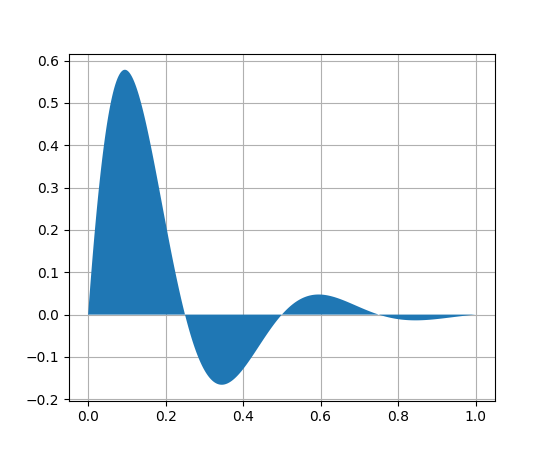
fill_between()Examples
(Source code, png, pdf)

Note
In addition to the above described arguments, this function can take a data keyword argument. If such a data argument is given, the following arguments are replaced by data[<arg>]:
- All arguments with the following names: ‘x’, ‘y’.
© 2012–2017 Matplotlib Development Team. All rights reserved.
Licensed under the Matplotlib License Agreement.
http://matplotlib.org/2.0.2/api/_as_gen/matplotlib.axes.Axes.fill.html