numpy.random.poisson
-
numpy.random.poisson(lam=1.0, size=None) -
Draw samples from a Poisson distribution.
The Poisson distribution is the limit of the binomial distribution for large N.
Parameters: lam : float or sequence of float
Expectation of interval, should be >= 0. A sequence of expectation intervals must be broadcastable over the requested size.
size : int or tuple of ints, optional
Output shape. If the given shape is, e.g.,
(m, n, k), thenm * n * ksamples are drawn. Default is None, in which case a single value is returned.Returns: samples : ndarray or scalar
The drawn samples, of shape size, if it was provided.
Notes
The Poisson distribution
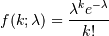
For events with an expected separation
 the Poisson distribution
  describes the probability of
  events occurring within the observed interval .
Because the output is limited to the range of the C long type, a ValueError is raised when
lamis within 10 sigma of the maximum representable value.References
[R255] Weisstein, Eric W. “Poisson Distribution.” From MathWorld–A Wolfram Web Resource. http://mathworld.wolfram.com/PoissonDistribution.html [R256] Wikipedia, “Poisson distribution”, http://en.wikipedia.org/wiki/Poisson_distribution Examples
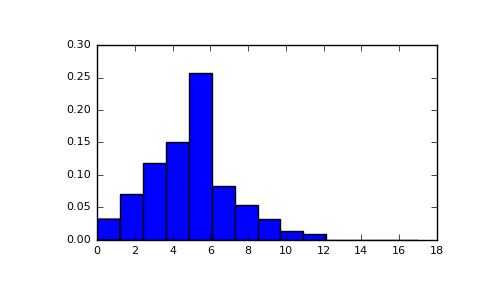
Draw samples from the distribution:
>>> import numpy as np
>>> s = np.random.poisson(5, 10000)
Display histogram of the sample:
>>> import matplotlib.pyplot as plt
>>> count, bins, ignored = plt.hist(s, 14, normed=True)
>>> plt.show()
(Source code, png, pdf)
Draw each 100 values for lambda 100 and 500:
>>> s = np.random.poisson(lam=(100., 500.), size=(100, 2))
()
© 2008–2016 NumPy Developers
Licensed under the NumPy License.
https://docs.scipy.org/doc/numpy-1.11.0/reference/generated/numpy.random.poisson.html